Overview
Performance Plus is a cloud-based energy analysis and building optimization platform which is ideally suited for Existing Building Commissioning (EBCx) projects. Performance Plus was developed by an in-house team of Cx Professionals, application programmers, and database managers at Building Energy Sciences (BES) and is distributed and supported by B.E.S. Plus Tech, a subsidiary of BES. The various sections of Performance Plus are utilized during the Investigation phase of an EBCx project, the operational testing phase, and the performance verification phase to identify, document, and implement facility improvements. Following completion of commissioning, the service is utilized during on-going building operation to continually assess and maintain the performance improvements obtained by the EBCx process.
Features
-
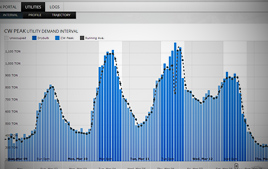 Based on data available from the monitored facility, Performance Plus will archive, display, and analyze historical energy consumption and demand for electric, natural gas, chilled water, heating water, etc.
Utility meter data can be imported down to 15-minute interval and explored dynamically across any desired time period for historical trend, occupied / unoccupied pattern analysis, weather to energy statistical correlation, baseline v. nominal year comparison, and various other analysis, charting, and reporting capabilities.
For facilities without interval metering equipment it is also possible to manually enter or upload monthly consumption and demand data to the platform. Data can also be exported from the platform into an Excel® spreadsheet for further custom analysis. -
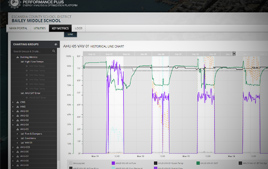 System operating variable trend data at 15-minute intervals (e.g. chilled water temps, fan speeds, supply air temps, outside air flow rate, etc.) are delivered nightly to the Performance Plus server from the BAS (data collected from temporary data loggers can also be manually uploaded to the platform).
The Cx Systems Analyst is able to visually analyze the key metric data in line chart form to observe dynamic system performance. System data can be visualized together with occupied time-of-day, controlled variables compared to setpoints, and control loop tuning is easily evaluated.
The data is also able to be visualized via other analysis charting such as carpet plots, data tables, and scatter plots. Data can be easily grouped by related system and categorized into sub-groups under each system. Data can also be exported from the platform into an Excel® spreadsheet for further custom analysis. -
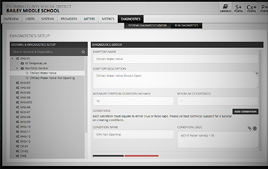 In addition to visual analysis of system operation via the Key Metrics module, this feature allows customized, highly configurable ‘Diagnostics’ to be set up which are processed each night on the previous day’s trended data providing ‘expert‐system‐based FDD’ (fault detection & diagnosis).
This allows an enormous amount of analysis to be performed with ‘Alerts’ generated and screened by skilled Cx System Analysts. These rules allow comparative logic, mathematical relations between variables, and time period / quantity of instance alert qualification logic.
-
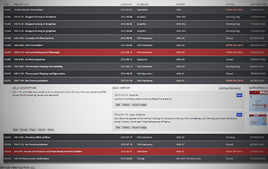 An integrated Diagnostics and Commissioning Issue Log can be accessed and utilized by all members of a project team including the Cx provider, controls contractor, facility management personnel, and other project management.
Tracking allows for the documentation of performance or commissioning issues including charts, pictures, PDFs, spreadsheets, and other documents specific to individual issues. Centralized cloud based issue tracking ensures all team members are enabled to follow issues as they arise.
The log can be filtered and sorted by various characteristics, and a report can be generated to PDF file by users any time.
